Interpreatation and modelling of the received kinetic data is essential to understand the measured phenomena. Our team use for example Maple and Mathlab softwares to model biophysical processes.
Collaboration partners: Eötvös Lóránd University

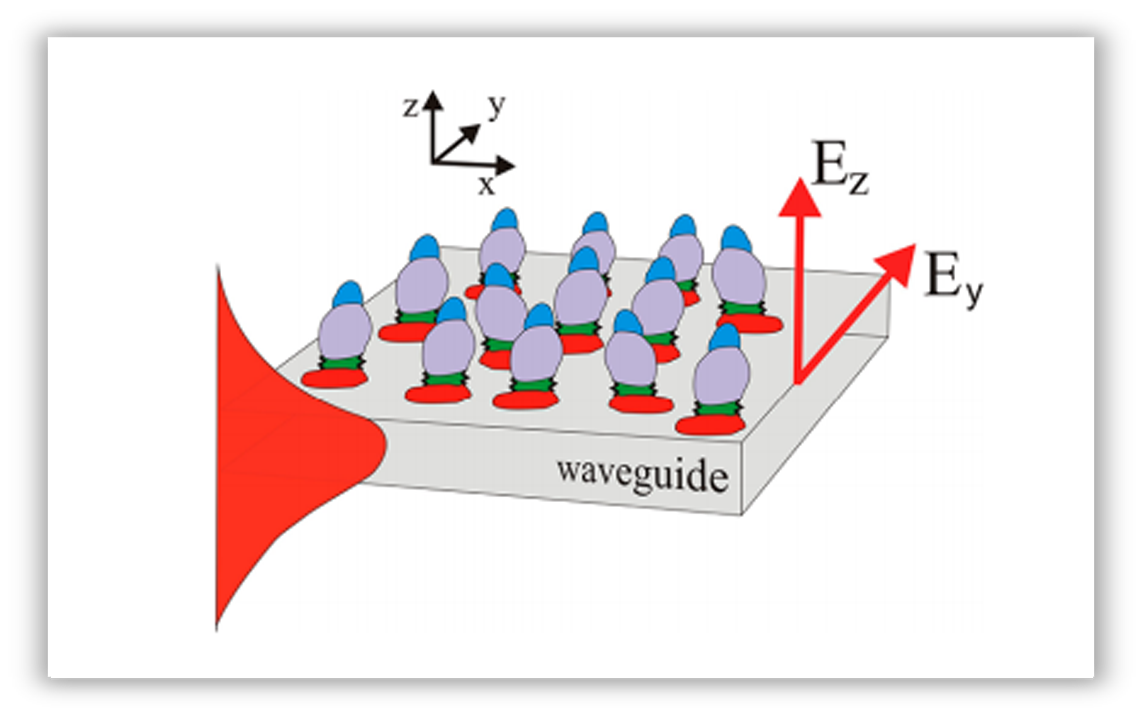
Optical guided mode traveling in the x direction detects the surface adsorbed protein layer through the
exponentially decaying evanescent field of the mode. The evanescent wave extends into the protein film
and senses the deposited molecules through their inherent refractive index. The orientation of the
exponentially decaying evanescent field of the mode. The evanescent wave extends into the protein film
and senses the deposited molecules through their inherent refractive index. The orientation of the
proteins in the adsorbed layer is detected by the y and z electric field components of modes.
 .
.

 .
.
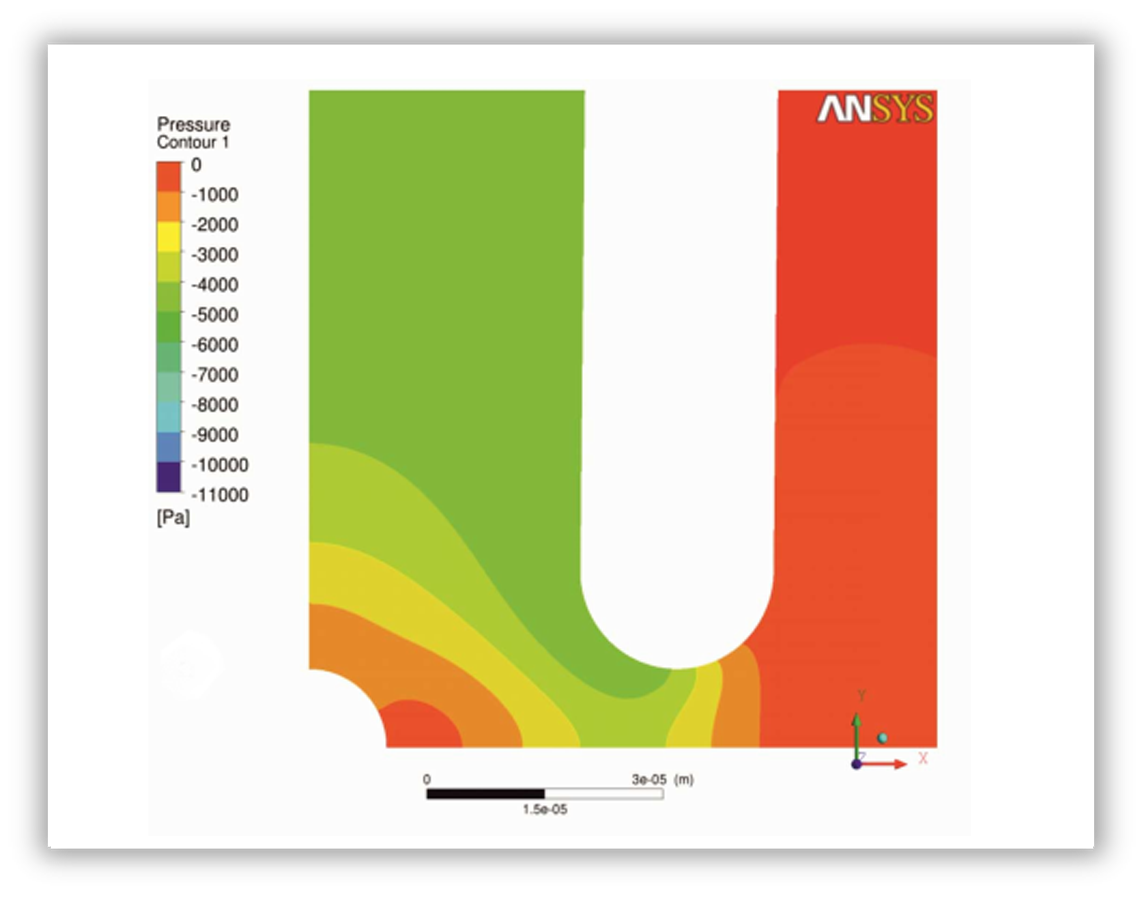
Typical pressure distribution in case of free-slip boundary conditions imposed on the bottom
of the Petri dish, calculated by numerical simulations.
of the Petri dish, calculated by numerical simulations.

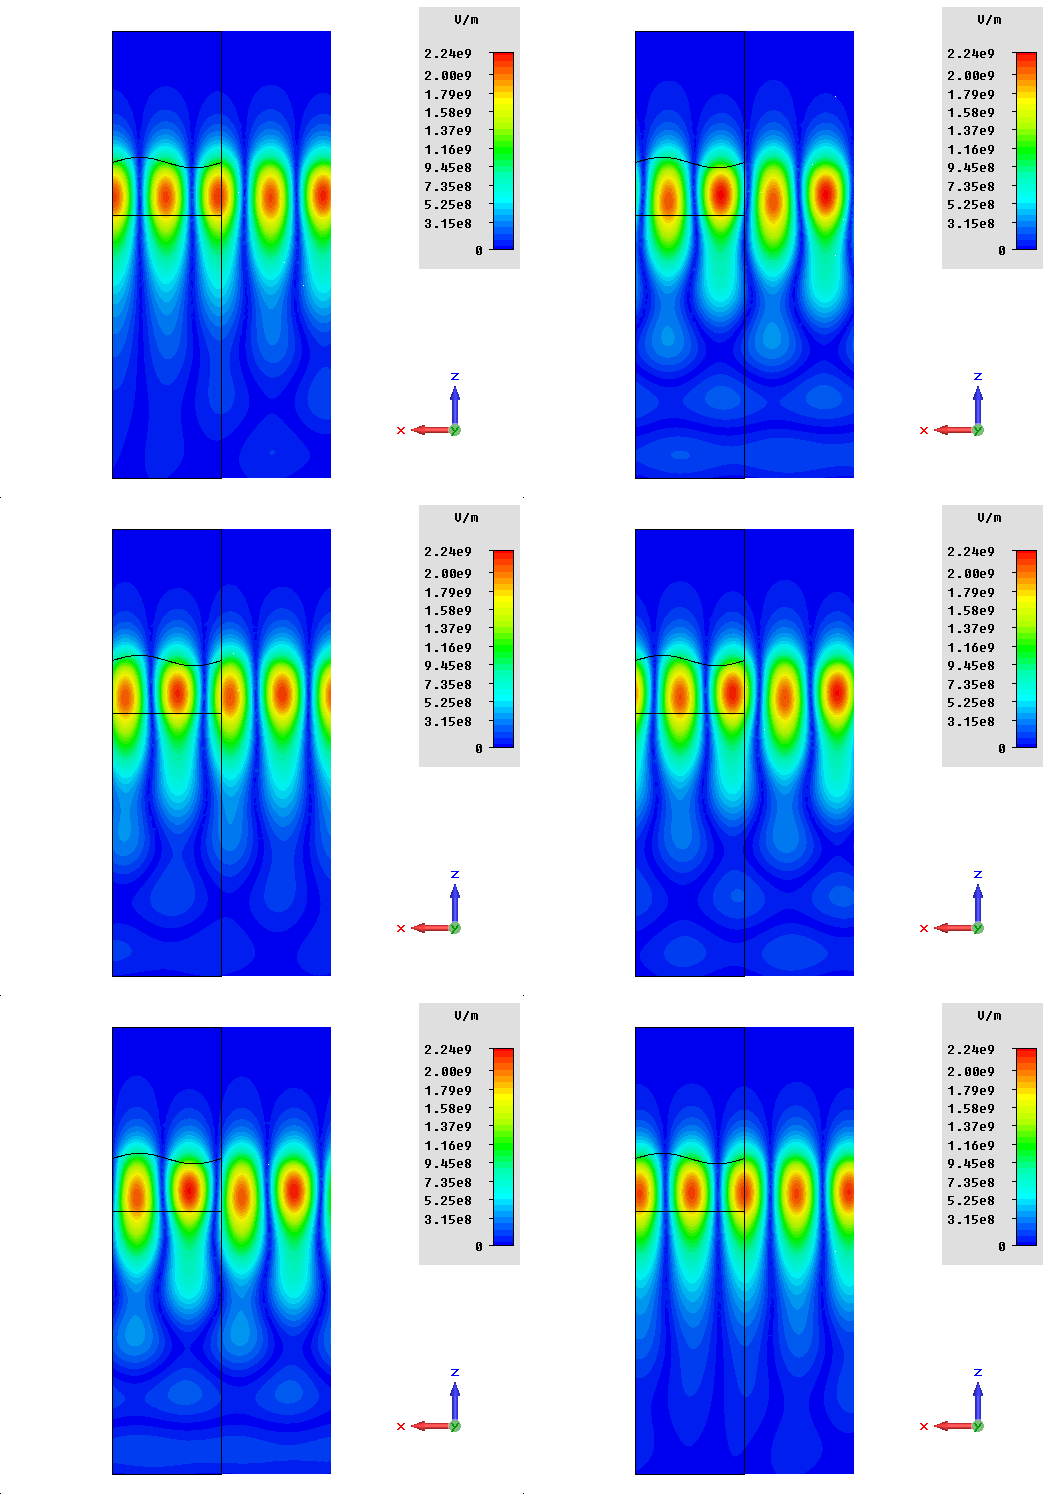
Steps of the numerical simulation to model inhomogeneous adlayers as homogeneous thin films.


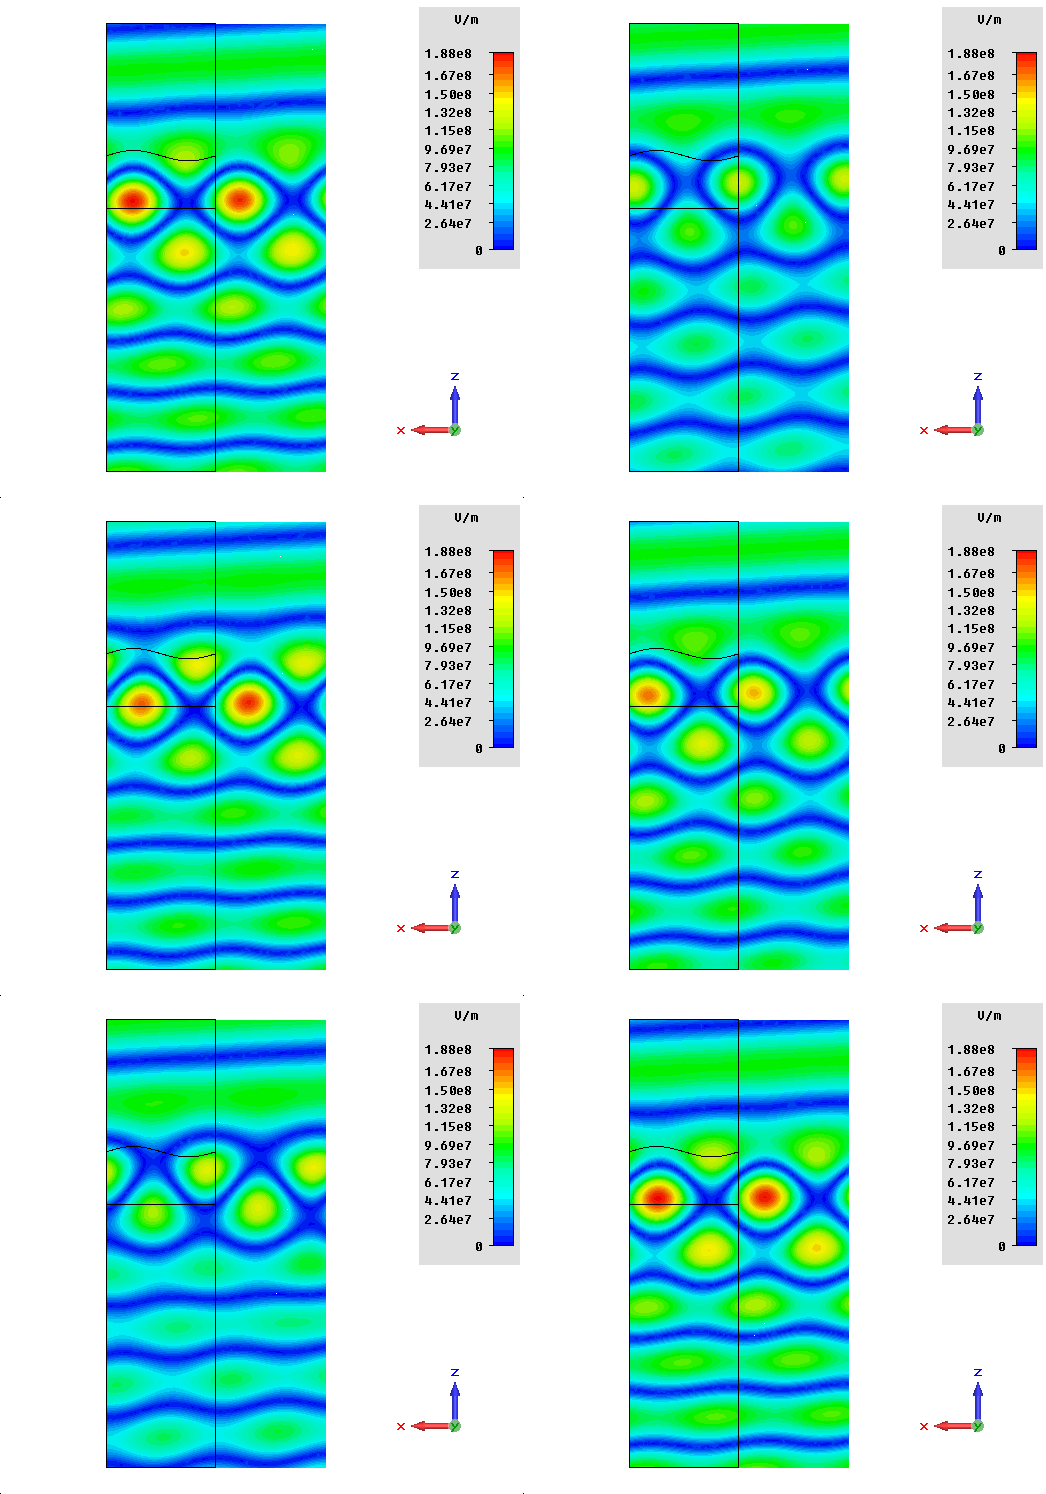
Wave propagation in grating coupled dielectric optical waveguide sensor at off and on resonance.
Relevant publications:
Kovacs et al. Optical Anisotropy of Flagellin Layers: In Situ and Label-Free Measurement of Adsorbed Protein Orientation Using OWLS. Analytical Chemistry, 2013
Juhasz and Horvath. Intrinsic structure of biological layers: Vertical inhomogeneity profiles characterized by label-free optical waveguide biosensors. Sensors and Actuators B: Chemical, 2014
Salanki et al. Single Cell Adhesion Assay Using Computer Controlled Micropipette. Plos One, 2014
Juhasz and Horvath. Intrinsic structure of biological layers: Vertical inhomogeneity profiles characterized by label-free optical waveguide biosensors. Sensors and Actuators B: Chemical, 2014
Salanki et al. Single Cell Adhesion Assay Using Computer Controlled Micropipette. Plos One, 2014

